U.S. Money Supply Is Making History on Both Ends -- Including a First Since the Great Depression -- and It Portends a Wild Ride for Stocks
May 31, 2025
Key Points
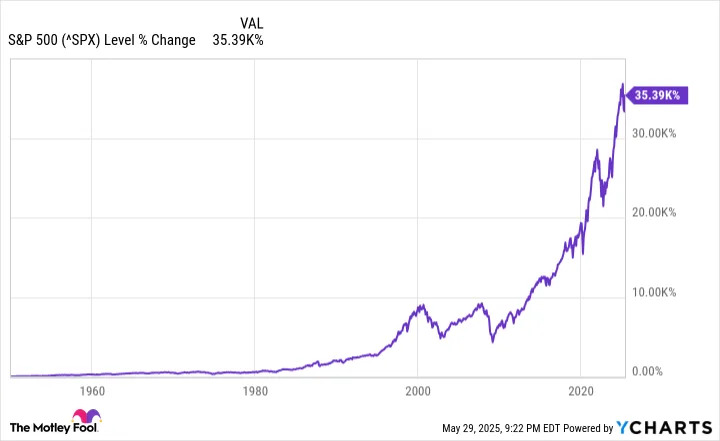
For more than a century, no asset class has come remotely close to matching the average annual return of stocks. But this doesn't mean Wall Street's major stock indexes move from point A to point B in an orderly fashion.
For instance, investors witnessed historic volatility in the ageless
Dow Jones Industrial Average
(DJINDICES: ^DJI)
, broad-based
S&P 500
(SNPINDEX: ^GSPC)
, and growth-propelled
Nasdaq Composite
(NASDAQINDEX: ^IXIC)
during the month of April. Wall Street's benchmark S&P 500 endured its
fifth-largest two-day percentage decline since 1950
and enjoyed its largest single-day nominal point gain since its inception -- all within one week.
When stock market volatility picks up in a meaningful way, it's not uncommon for investors to seek out data points and events that correlate with significant moves higher or lower in the Dow Jones, S&P 500, and Nasdaq Composite. Even though no such metric or event can guarantee the next directional move in stocks, there are some correlative metrics and events that have phenomenal track records of foreshadowing big moves in equities.
One such metric, which has been tugged in both directions over the last three years, portends a wild ride to come for stocks.
U.S. money supply is making history on both ends of the spectrum
The monthly reported metric that has historically had an uncanny ability to forecast the future is none other than the U.S.
money supply
.
Though there are five separate measures of money supply, M1 and M2 tend to be the most important. The former is a measure of cash and coins in circulation, as well as demand deposits in a checking account. It's money that can be accessed with ease and spent at a moment's notice.
Meanwhile, M2 takes everything in M1 and adds in savings accounts, money market accounts, and certificates of deposit (CDs) below $100,000. This is still money that can be spent, but it requires more effort to access. It's this U.S. money supply measure that has been making history on both ends of the spectrum.
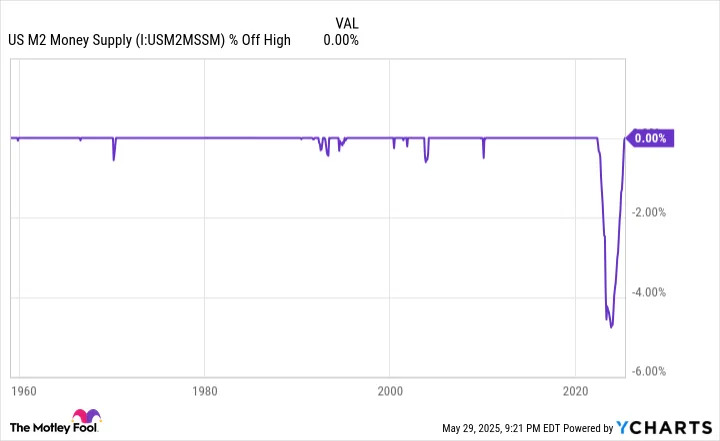
On one hand, M2 money supply plunged by more than $1 trillion, equating to a peak-to-trough decline of 4.76% between April 2022 and October 2023. This marked the first time since the Great Depression that M2 has declined by at least 2% on a year-over-year basis, as well as on a cumulative basis from a recent all-time high.
As you'll note in the post above from Reventure App CEO Nick Gerli, there have only been five instances in the last 155 years where we've observed a year-over-year decline of at least 2% in U.S. M2 money supply: 1878, 1893, 1921, 1931-1933, and 2023.
Even though Gerli's post is now more than two years old, it demonstrates the strong correlation between declines in M2 money supply and trouble for the U.S. economy and Wall Street. Each of the previous four instances where M2 money supply notably dropped coincide with periods of economic depression and double-digit unemployment for the U.S. economy.
The caveat to this correlation is that a lot has changed from the four previous occurrences to the present day. For instance, the Federal Reserve didn't exist in 1878 or 1893. What's more, monetary and fiscal policy have evolved in a big way since the 1920s and 1930s. The likelihood of a depression taking shape in modern times, with a double-digit unemployment rate, is
extremely
low.
Nevertheless, a first-in-90-years decline in M2 money supply heightened the possibility of a near-term U.S. recession.
But as noted, there are two sides to this coin.
Just days ago, the Board of Governors of the Federal Reserve System reported that the U.S. M2 money supply hit an all-time record high of $21.863 trillion in April 2025. The entirety of the 4.76% peak-to-trough drop between April 2022 and October 2023 has been erased.
A steadily climbing money supply is typically something observed when the U.S. economy is firing on all cylinders. A growing economy needs more capital in circulation to facilitate transactions and cover modest inflation. A record high for M2 would appear to bode well for the U.S. economy in the near term.
Additionally, M2 money supply increased at its fastest pace since 1870 during the height of the COVID-19 pandemic (more than 26% on a year-over-year basis). It's possible that the 4.76% decline observed from April 2022 to October 2023 represents nothing more than a benign reversion to the mean after a historic jump in available capital.
This whipsaw effect in M2 over the last three years, which is something not witnessed since the mid-1930s, suggests stocks may be extra volatile in the quarters and years to come.
Patience portends profits on Wall Street
Although the past couple of months have been extra volatile for the Dow Jones Industrial Average, S&P 500, and Nasdaq Composite, and recent shifts in M2 suggest this volatility may continue, there's no reason for patient investors to be alarmed. Time has a way of handsomely rewarding those with a long-term mindset.
For example, Gerli's data set speaks to a strong correlation between notable declines in the M2 money supply and weakness in the U.S. economy. Though downturns in the economy can be worrisome from the perspective of wage and job growth, they're most importantly short-lived.
Since World War II ended in September 1945, no U.S. recession has lasted longer than 18 months, and the average economic contraction has endured for just 10 months. In comparison, the average period of growth during this same time frame is about five years. The U.S. economy spends a disproportionate amount of time growing, and that's generally a good thing for corporate earnings.
This same nonlinearity can also be observed in stock market cycles. According to Bespoke Investment Group, the average S&P 500 bear market has lasted just 286 calendar days since the start of the Great Depression (September 1929). Comparatively, the typical S&P 500 bull market has endured 1,011 calendar days over the same span (through June 2023).
What's more, patience has, thus far, an immaculate track record of forecasting the future.
Every year, the analysts at Crestmont Research update their data set that examines the rolling 20-year total returns, including dividends paid, of the S&P 500 from the beginning of the 20th century onward. Even though the S&P didn't officially exist until 1923, researchers were able to track the total return of its components in other major indexes from 1900 to 1923.
Altogether, Crestmont Research has examined 106 rolling 20-year periods of total return data (1900-1919, 1901-1920, and so on, to 2005-2024). All 106 periods would have produced a positive annualized rate of return.
In other words, if an investor had hypothetically purchased an S&P 500 tracking index at any point from 1900 to 2005 and simply held their position for 20 years, they would have grown their wealth every time. Regardless of whether they held through a depression or recession, a pandemic, or purchased at a market top, they always came out ahead if they simply maintained perspective and demonstrated patience.
Should you invest $1,000 in S&P 500 Index right now?
Before you buy stock in S&P 500 Index, consider this:
The
Motley Fool Stock Advisor
analyst team just identified what they believe are the
10 best stocks
for investors to buy now… and S&P 500 Index wasn’t one of them. The 10 stocks that made the cut could produce monster returns in the coming years.
Consider when
Netflix
made this list on December 17, 2004... if you invested $1,000 at the time of our recommendation,
you’d have $651,049
!*
Or when
Nvidia
made this list on April 15, 2005... if you invested $1,000 at the time of our recommendation,
you’d have $828,224
!*
Now, it’s worth noting
Stock Advisor
’s total average return is
979% — a market-crushing outperformance compared to
171%
for the S&P 500. Don’t miss out on the latest top 10 list, available when you join
Stock Advisor
.
Sean Williams
has no position in any of the stocks mentioned. The Motley Fool has no position in any of the stocks mentioned. The Motley Fool has a
disclosure policy
.